Menu bar — train without giving up your screen
WattLog.pro lives in your macOS menu bar. While you ride, your current heart rate, power and cadence are visible at the top of the screen at all times — ♥ 103 ⚡ 117 ↻ 75 — updating every second.
Click the menu bar icon and a compact dropdown shows HR, Power, Cadence and Grade in large, colour-coded numbers. That's it. Then you can go back to whatever you were doing. Grade appears in the dropdown only — the strip stays clean with three numbers.
This means you can train while watching a film, a YouTube video, reading — anything. No virtual worlds competing for your attention. No mandatory screen. WattLog.pro records everything in the background; you get the full analysis after the ride.
Every other indoor training app requires you to watch the app. WattLog.pro doesn't.
Live session data
While you ride, WattLog.pro shows power (W), heart rate (bpm), cadence (RPM), current power zone, interval timer, and elapsed time — all updated in real time. The interface is designed to be readable at a glance from a trainer position, with large numbers and high contrast.
Power zones are colour-coded using the Coggan 7-zone model, so you can see at a glance whether you're in the right zone without taking your eyes off the road (or the wall in front of you).
Automatic FTP detection
FTP (Functional Threshold Power) is the foundation of every power-based metric. WattLog.pro estimates it from your actual ride data using a best-20-minute power algorithm — no dedicated test ride needed, no guessing. The number updates automatically as you improve.
If you already know your FTP, you can set it manually. The auto-detection runs in the background and will suggest an update when it has enough data.
Post-ride analysis
Every session produces a report with the metrics that actually matter:
- Weighted Average Power (WAP) — a better measure of effort than average power, accounting for the cost of surges and variability.
- Relative Intensity (RI) — how hard was this ride relative to your FTP? RI 0.75 is a recovery spin; RI 1.05 is a hard threshold effort.
- Training Load Score (TLS) — the total load of the session. Comparable across rides of different length and intensity.
- Cardiac drift % — did your heart rate drift relative to power over the ride? High cardiac drift means your aerobic system was stressed. Low drift means it was well within its limits.
- Time-in-zone breakdown — exactly how many minutes you spent in each of the 7 power zones.
- Power PRs — best 1-minute, 5-minute, 20-minute and 60-minute power from this session, flagged if any are all-time records.
Every metric has a plain-English explanation built in. Tap any number to understand what it means and whether your result was good, neutral or something to pay attention to.
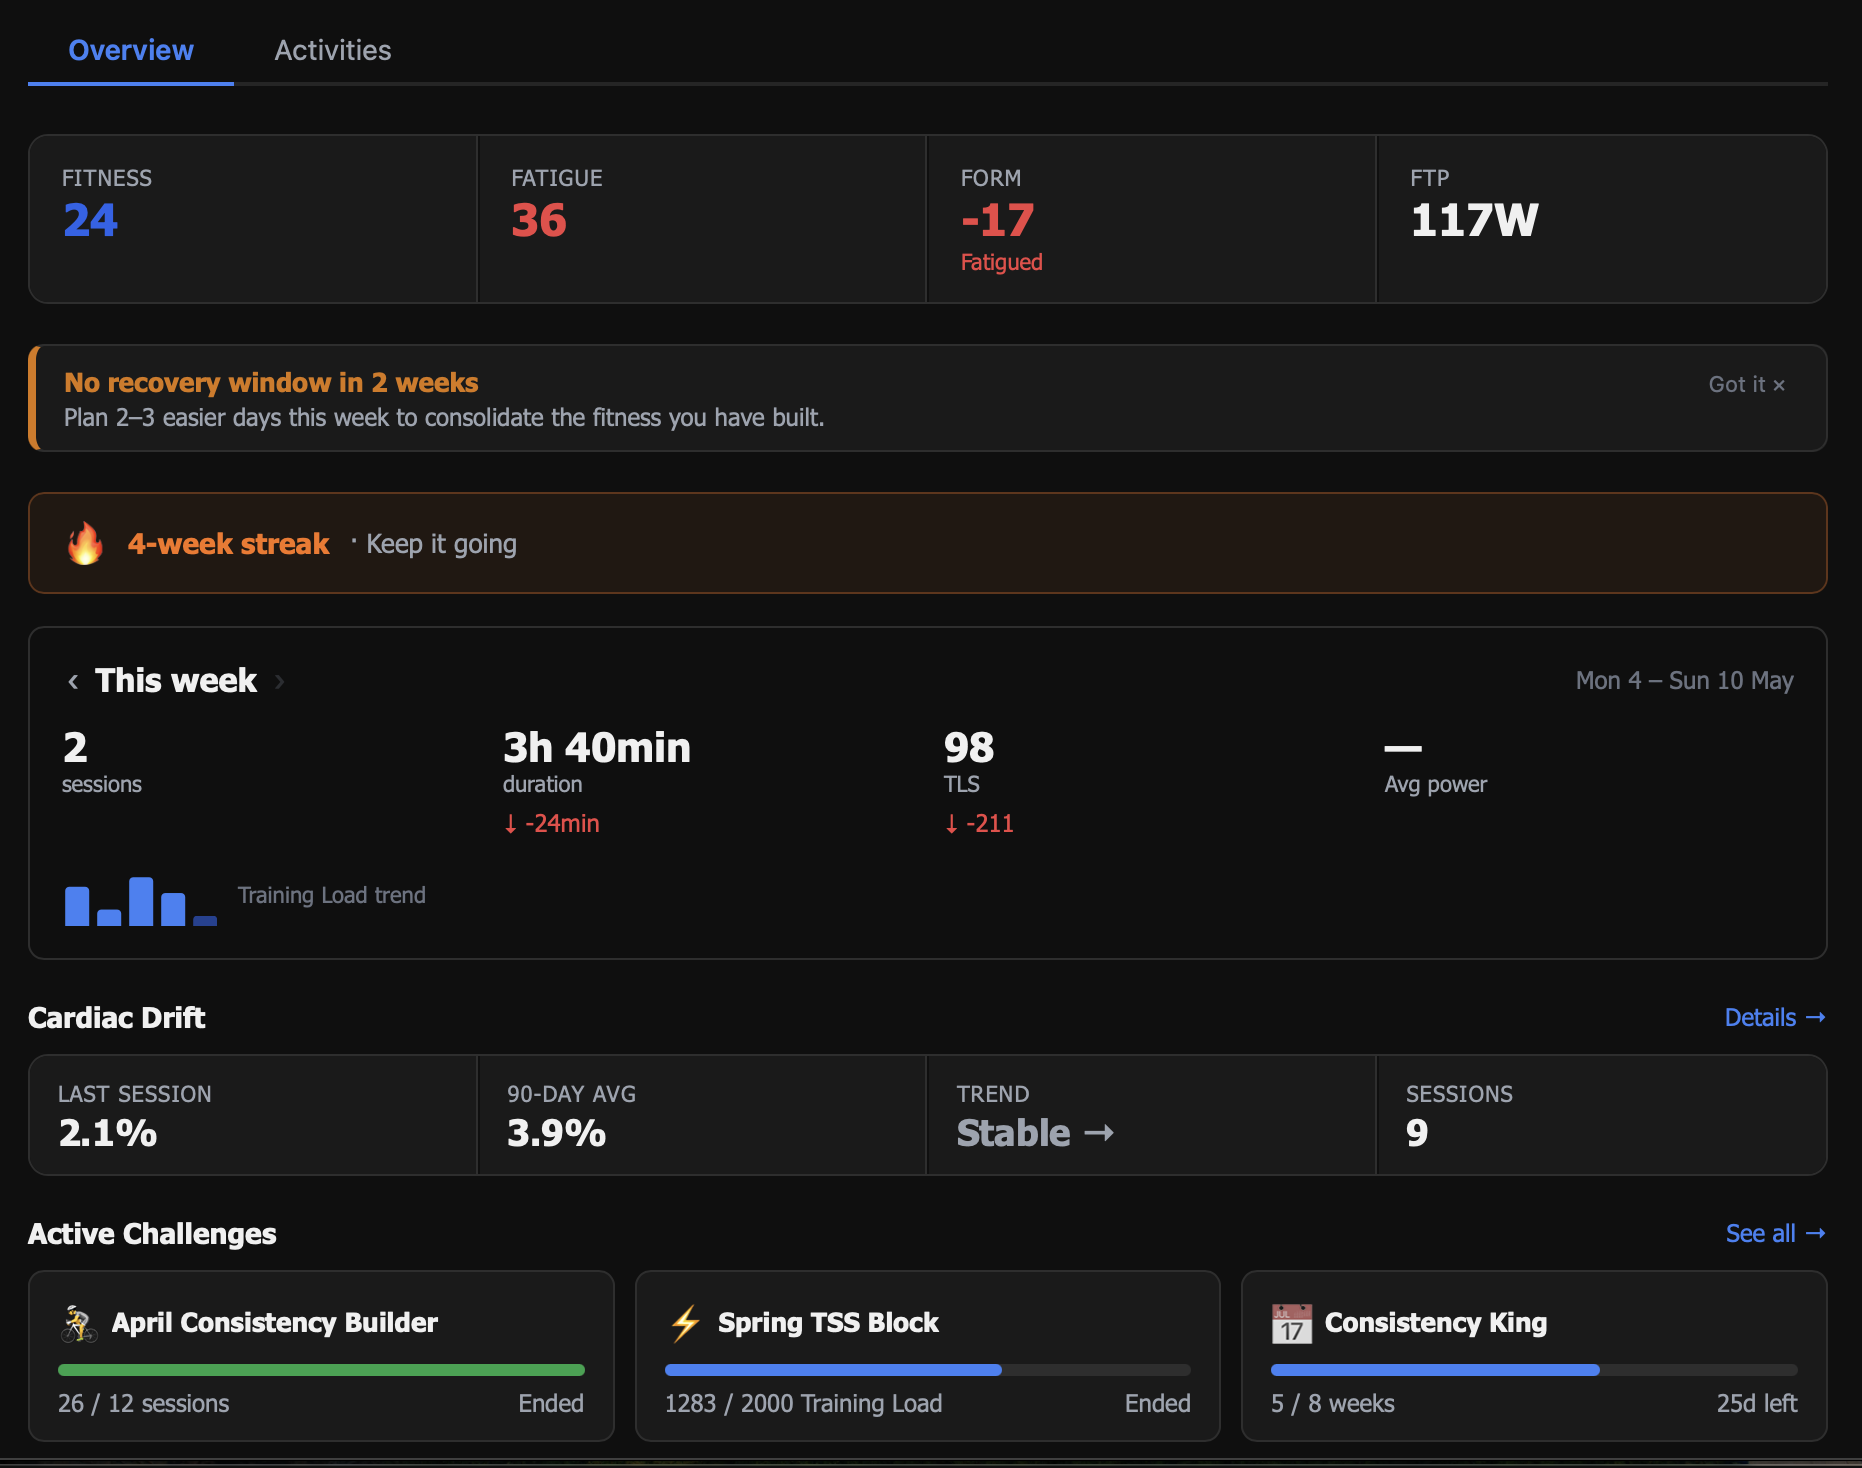
Recovery intelligence — your body talks, WattLog.pro listens
WattLog.pro monitors your training stress continuously and flags when your body needs a break. If you haven't had a proper recovery window in two weeks, the app tells you directly:
Plan 2–3 easier days this week to consolidate the fitness you have built.
This isn't a generic reminder. The alert fires based on your actual Fatigue and Fitness data — it appears when fatigue has been accumulating without a real drop, meaning the fitness you've built is at risk of stalling or reversing.
The same intelligence surfaces in the Dashboard view alongside your weekly summary, active challenges and cardiac drift trend — everything in one place, no separate app or manual log needed.
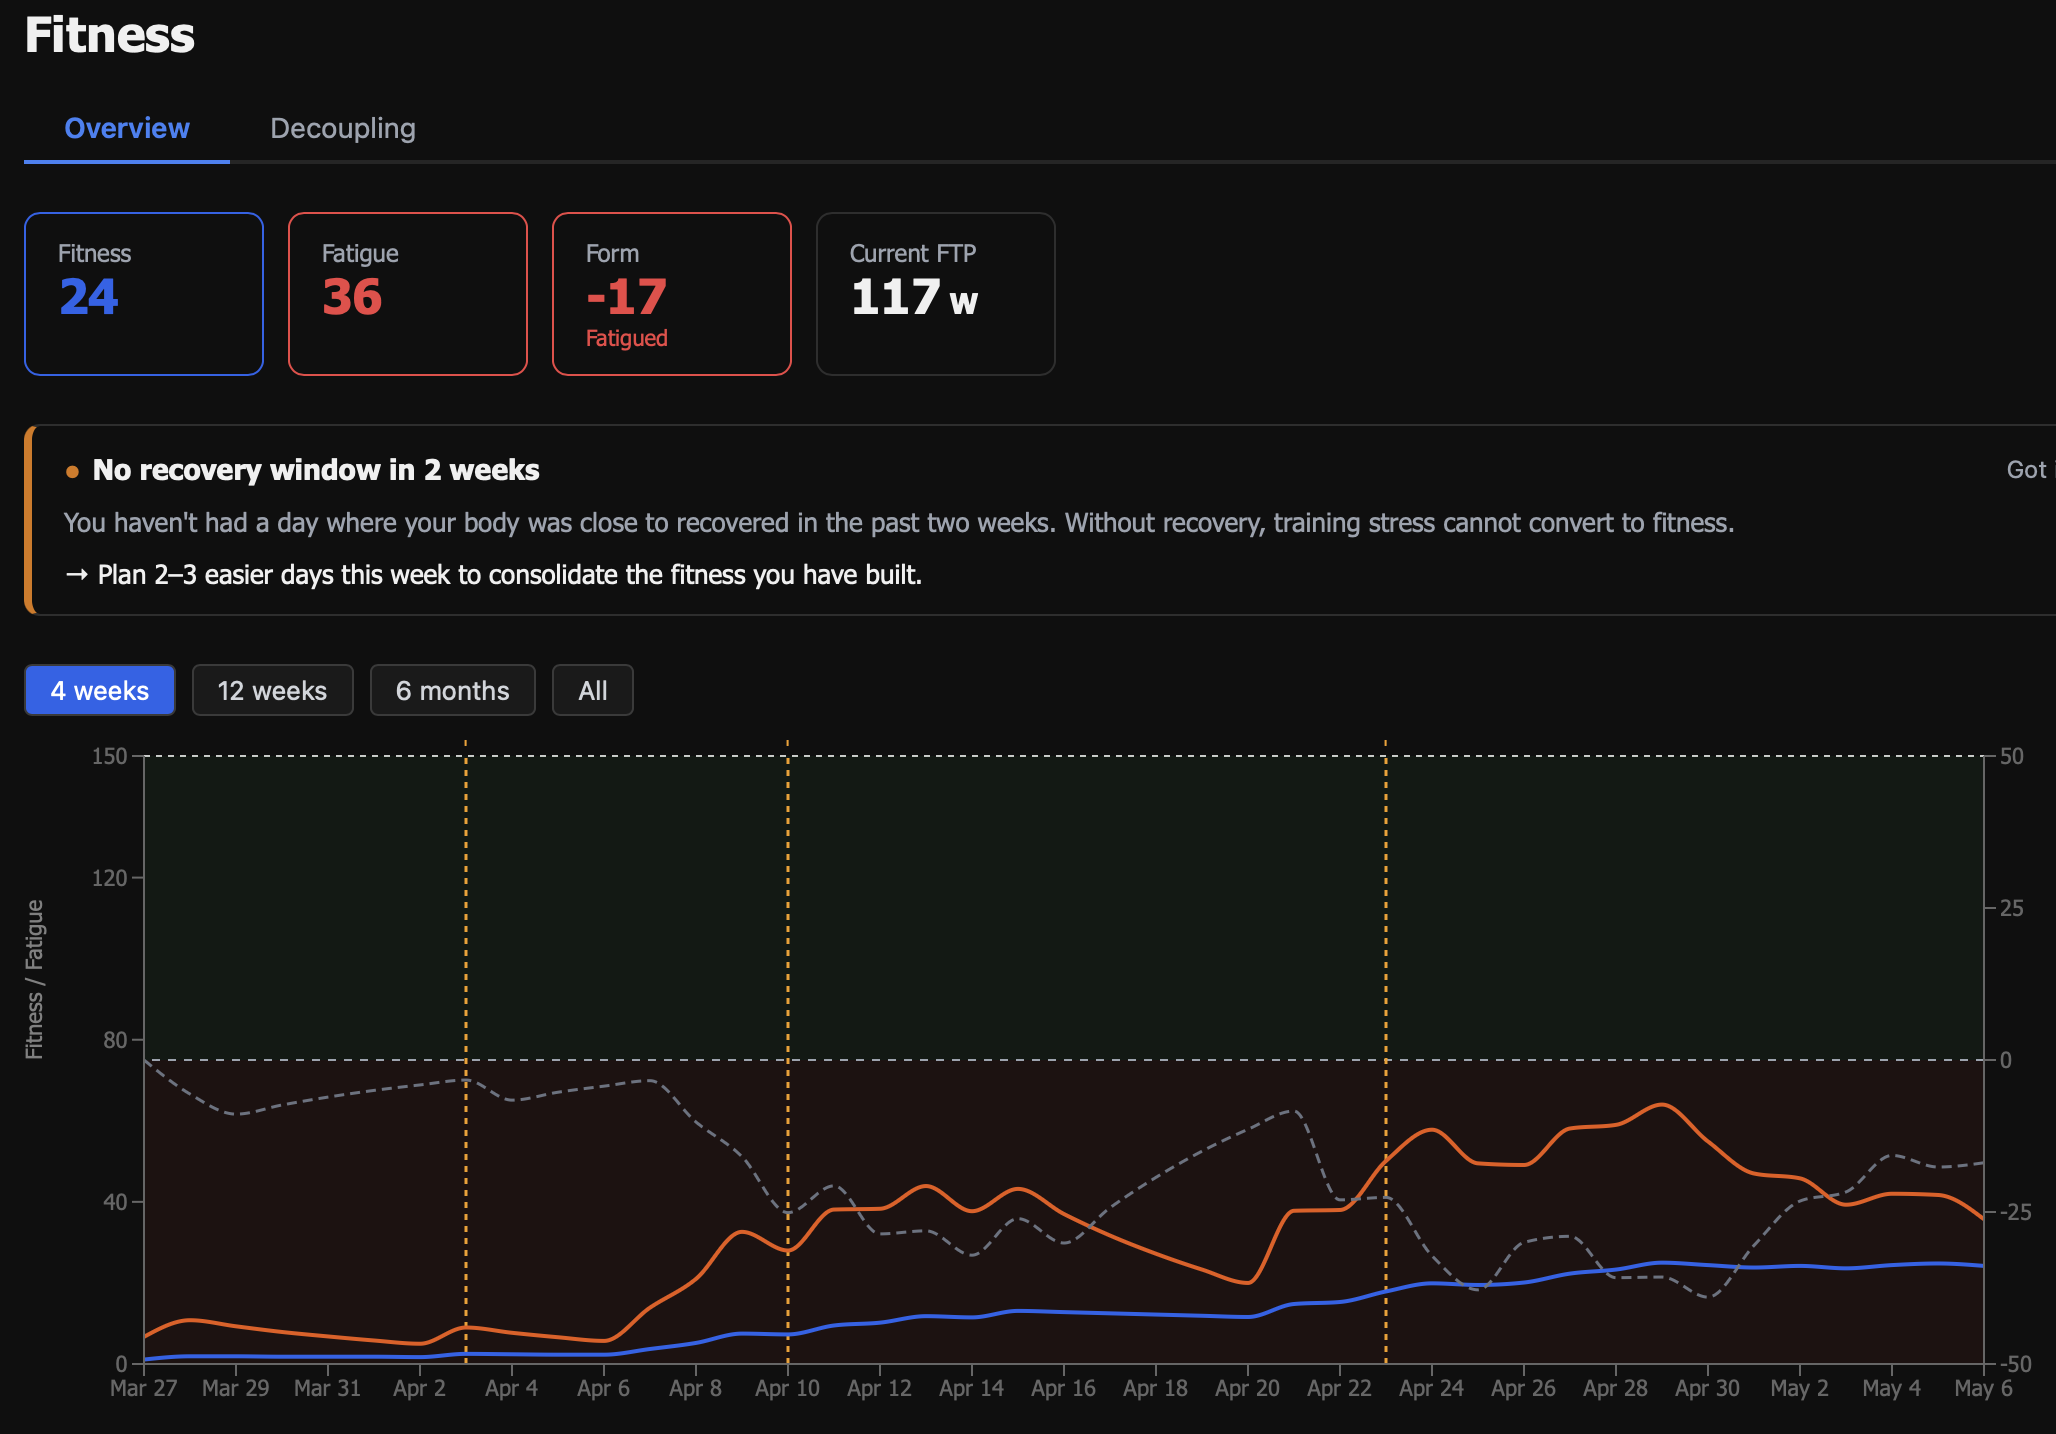
Fitness Management Chart
The Fitness Management Chart shows three numbers across a rolling timeline:
- Fitness — the weighted average of your TLS over the past 42 days. Higher is generally better, but it takes weeks to build.
- Fatigue — the weighted average over the past 7 days. Spikes when you train hard.
- Form — Fitness minus Fatigue. Positive means fresh; negative means fatigued. The art of training is managing the gap.
The Fitness Management Chart is the single most useful view for understanding whether your training is working. WattLog.pro builds it automatically from your session history — no manual input required.
Virtual rides from GPX files
Any GPX file — a route you downloaded, a road you mapped yourself, a famous climb — can be turned into a virtual ride. Load the file into WattLog.pro and your trainer will follow the elevation profile automatically, increasing and decreasing resistance as the gradient changes.
This means you can ride Alpe d'Huez, your local favourite, or a stage of the Tour de France — all without leaving your pain cave. No subscription to a virtual world required.
Import activities from TCX files
Already have a library of indoor rides from another app or a Garmin device? Import them as .tcx files and WattLog.pro will pull them into your history — power, heart rate, cadence, the works. Your PMC, TLS and all long-term analytics will reflect your full training history, not just the sessions recorded in WattLog.
Useful if you're switching from another platform and don't want to start from scratch, or if you occasionally train on a different device and want everything in one place.
Data export — your data, always yours
Every session can be exported as TCX or FIT — the standard formats used by Garmin Connect, Strava, TrainingPeaks and every other platform. If you ever want to leave WattLog, you take everything with you.
We don't believe in data lock-in. Export works on every plan, including the free Founding Rider tier.