30 Metres Left Where I Turned Back — a Second Attempt at St. Anne's Mountain and Climb View
In August I turned around 1.3 km short of the summit of Góra Świętej Anny (St. Anne's Mountain). Two months later I rode the same finale again, this time on the trainer, with a new panel in the cockpit. At the spot where I had turned back, the panel read: 1.3 km to the top, +30 m of ascent left.
I told the first part of this story in “1.3 km Short of the Summit”: 144 km solo, TSS 400, climbs ridden like intervals and a U-turn right below the sanctuary. The analysis of that ride became Power Guide, a power plan for every section of a route. This post is about the second feature that grew out of the same day, and how it held up on the second attempt.
What I couldn't see on the climb
When I went back to the August data, I checked exactly where I had turned around. I compared that ride's GPS track with the route to the summit: up to the turnaround point both follow the same road, then my track turns off. 1.3 km was left to the top, and a good part of it was flat. The longest steep stretch was already behind me. Ahead was a section where I could have recovered, and only then the last short wall.
A power plan tells you how hard to ride. It does not show the shape of the climb: how far it is to the top, where the climb eases off and where it gets steepest. Those are the things that decide, on a climb, whether you keep going. That is how Climb view came about. The idea is not new: Garmin's head units have ClimbPro, one of their more popular navigation features. I wanted the same thing in WattLog.pro's route cockpit, combined with the power target from Power Guide.
How Climb view works
What counts as a climb
A route is stored as 50-metre segments, each with its own grade. WattLog.pro looks for climbs in them with rules close to ClimbPro's:
- a climb starts on the first stretch of at least 3% and ends on the last such stretch;
- in between it may have easier bits, even descents, up to 1 km in a row, as long as it loses no more than 10 m from its highest point. The flat section below St. Anne's fits this rule, which is why the whole finale is one climb rather than two;
- to count at all it needs at least 500 m, an average of at least 3%, and a product of its length in metres and its average grade in percent of at least 1,500;
- the category is worked out the way Strava does it, from the same product: Cat 4 from 8,000, Cat 3 from 16,000, Cat 2 from 32,000, Cat 1 from 64,000, HC from 80,000.
Garmin does not publish exactly where a climb starts and ends, so the rules about flat sections are my own. The finale to St. Anne's is 2.6 km at an average of 3.2%, a product of 8,300: Category 4, just over the line.
What the panel shows
500 m before a climb, the cockpit announces it: “Climb · ahead” (“Climb 2 of 5” on a route with several climbs), a countdown “in 300 m” and the power target for the start of the climb from Power Guide, e.g. “target 130 W”. On the climb itself the panel shows:
- a mini profile of the climb in bars of about 100 m, coloured by grade: grey below 3%, yellow 3–6%, orange 6–9%, red 9–12%, dark red above that. The white line is where you are;
- the distance to the top in kilometres and the metres of ascent left;
- the grade here and the average grade to the top.
The route page lists every climb with its length, ascent, grade and category. Hovering over the elevation profile shows a preview of the panel at exactly that point of the route. The screenshots below come from that preview: they show the same thing the cockpit shows at that point of the climb.
The second attempt
On 12 October I rode the route from Tarnowskie Góry to Góra św. Anny, 55.85 km, on the trainer in SIM mode: the resistance follows the grade of the route. I rode with the Power Guide “Easy finish” plan at an FTP of 184 W: 120 W on the flat, 130–134 W on the climbs. The whole ride took 1 h 57 min, normalized power 125 W, TSS 89.
Stage one: steepest at the start
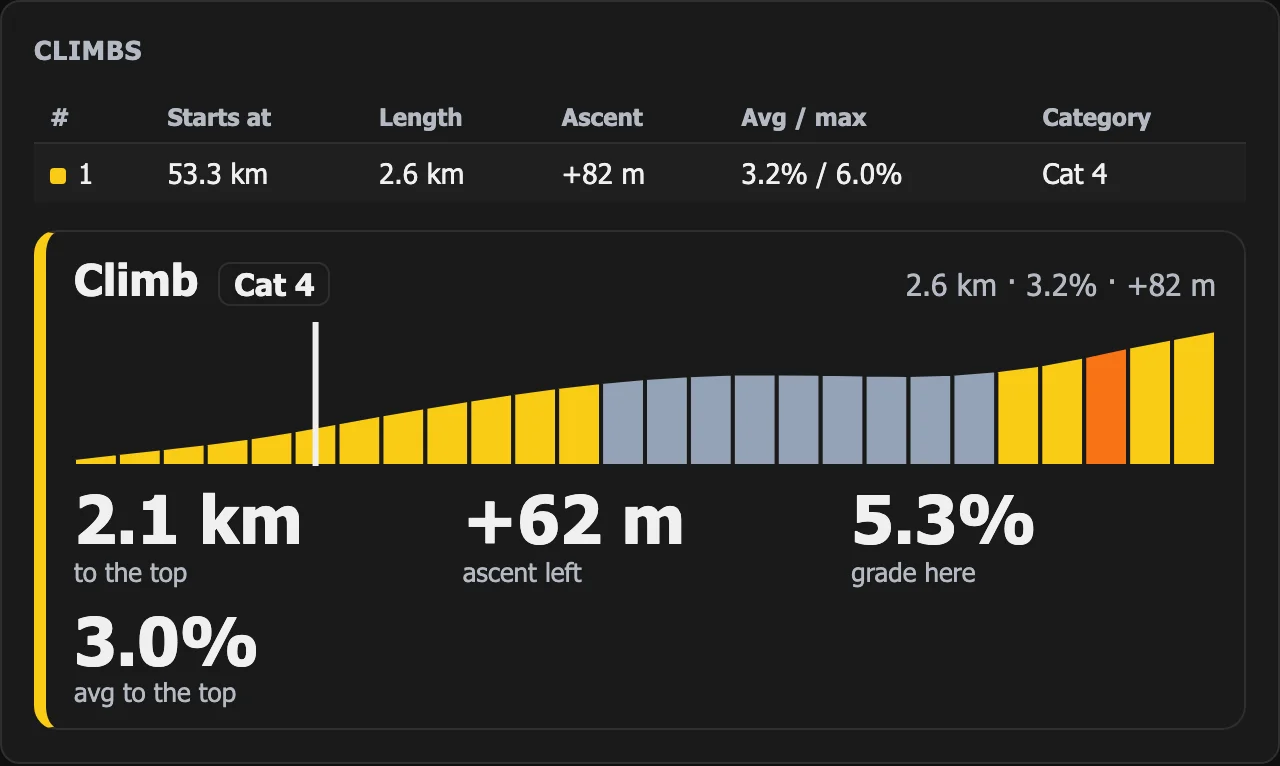
The first kilometre is the longest steep stretch, up to 5%. I could see it ended in a grey section, so I knew how long I had to hold on before I could breathe. I rode it at 136–141 W, a little above the 130–134 W target.
Stage two: where I turned around in August
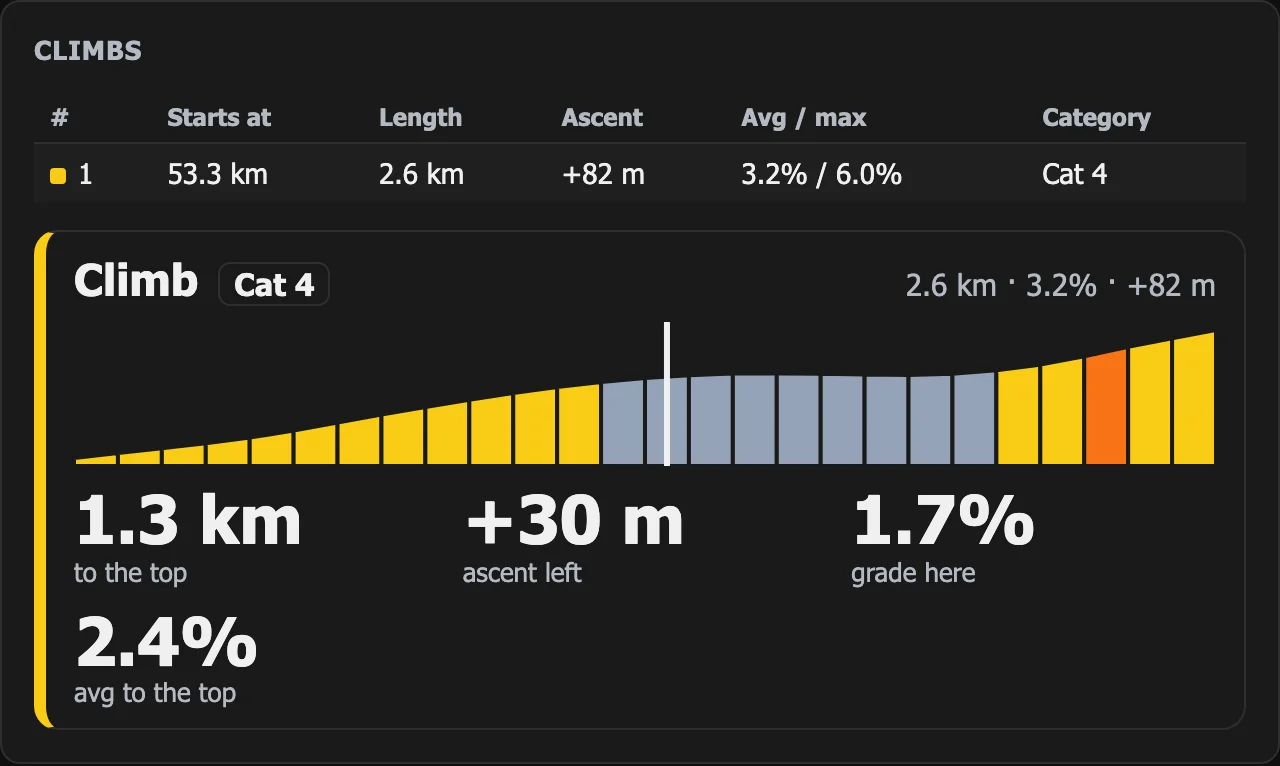
This was the point where I gave up in August. This time the panel said it plainly: 1.3 km, 30 m, an average of 2.4% to the top, and the next few hundred metres almost flat. I eased off: on the flat section I averaged 59 W, and my average heart rate dropped from 140 to 129. It wasn't weakness, it was a deliberate rest before the final ramp, which I could see coming.
Stage three: the final wall
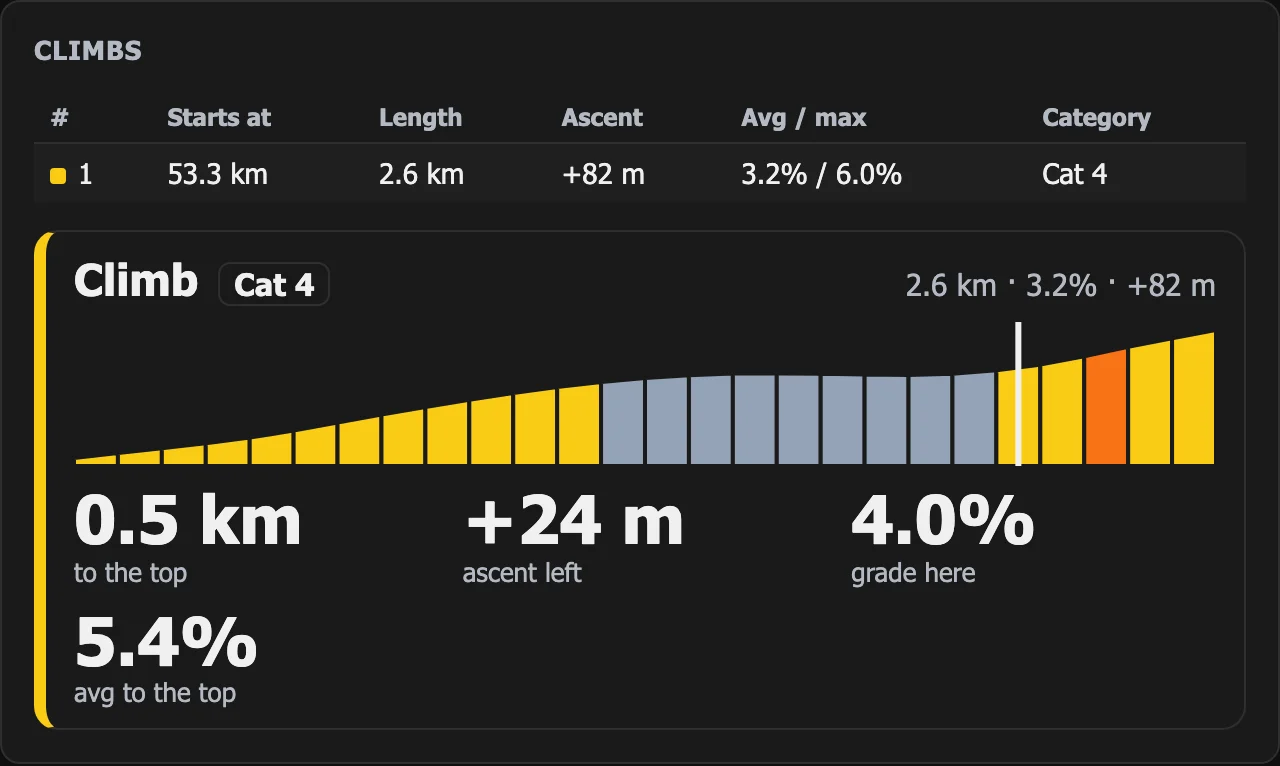
The last 500 m are the steepest part of the whole climb, up to 6%. I knew it was only 24 m, so I rode it hardest: 155–158 W. My heart rate reached 148.
Here is the whole climb in numbers, every half kilometre:
| Stretch (route km) | Terrain | Power | Heart rate | Cadence |
|---|---|---|---|---|
| 53.25–53.75 | 3–4% | 141 W | 139 | 86 rpm |
| 53.75–54.25 | 4–5% | 136 W | 140 | 79 rpm |
| 54.25–54.75 | 4% → 1% | 107 W | 138 | 90 rpm |
| 54.75–55.25 | flat | 59 W | 129 | 93 rpm |
| 55.25–55.85 | 2% → 6% | 155–158 W | 139–147 | 82–88 rpm |
I rode the end hardest, not the start. In August it was the other way round: I rode the best three minutes of the approach to the sanctuary at 192 W, 110% of my FTP at the time, with my heart rate at 175, and then I stopped. This time the best three minutes of the climb were 146 W, and my maximum heart rate was 148.
How it felt. The climb was easier to fight when I could see its individual stages. I wasn't riding up “a mountain” but through three pieces: a steep one, a flat one and a short wall. Each had an end I could see on the profile.
The post-ride pacing audit, which compares what you rode with the Power Guide plan section by section, had a single remark this time, and not about the climb: I rode the flat section before the climb too easy, at 82% of target. On the climbs I stayed within 92–103% of target. In August the same audit flagged four climbs in a row as too hard.
What a climb panel gives you beyond the numbers
You can pace a climb with just a plan and a power readout. The panel adds something else: knowing how much effort is left and how it is distributed.
- A known end to the effort. Exercise physiology describes pacing as anticipatory control: the brain doles out effort according to how much it expects is still to come. Ulmer called this teleoanticipation [1], and Tucker described how the expected duration of an effort shapes perceived fatigue from the first minutes [2]. In a study on runners, people who did not know how long the effort would last, or found out midway that it would last longer, rated it worse than those who knew from the start [3]. The panel turns “no idea how much longer” into “1.3 km and 30 m”.
- The climb in pieces. The coloured profile splits the climb into sections with a visible end. That is exactly what I described above: three short stretches are easier to ride than one long mountain.
- Better power distribution. You can see where it is steepest, so you don't have to burn out at the bottom if the hardest part comes at the end. Swain's model shows that on variable terrain it pays to ride a little harder where it is steep and a little easier where it is easier [4]. The panel shows exactly where “steep” and “easier” are on this particular climb.
- Getting ready before the grade changes. When you can see it will hit 6% in 200 m, you can shift down and settle your cadence in time, instead of grinding a big gear.
- Places to recover. The grey bars are flat sections. On St. Anne's, that is where I got my legs back before the finish.
What this doesn't prove
- It's one ride, not a study. In October I reached St. Anne's after 53 km on the trainer, on a ride worth 89 TSS in total. In August I was 70 km into a road ride, had started tired (TSB −15) and had dozens of over-hard surges behind me. It was an easier day, so the panel is not the only reason I made it up this time.
- The panel doesn't know how tired you are. It shows the terrain, and it takes its power target from Power Guide, which assumes a fresh rider. After a few hours of riding, the same metres hurt more.
- The climb detection rules are a first approximation. I'll tune the thresholds of 3%, 500 m, 1 km of flat and 10 m of drop on more routes. On some routes two climbs separated by a longer flat may be split, even though people ride them as one.
- It works in the route cockpit. The panel is part of route rides in WattLog.pro, on a computer and on a phone in portrait. You can turn it off in the settings (Climb view).
What I take away from it
In August I thought my legs had run out. The data showed that what I lacked was pacing, and knowing what was still ahead of me. Power Guide answers “how hard”. Climb view answers “how much more, and what shape”. In October, at the spot where I had turned back before, I saw 30 metres, recovered on the flat and rode the final ramp hardest.
Sources
- Ulmer HV. Concept of an extracellular regulation of muscular metabolic rate during heavy exercise in humans by psychophysiological feedback. Experientia. 1996;52(5):416–420. doi:10.1007/BF01919309
- Tucker R. The anticipatory regulation of performance: the physiological basis for pacing strategies and the development of a perception-based model for exercise performance. Br J Sports Med. 2009;43(6):392–400. doi:10.1136/bjsm.2008.050799
- Baden DA, McLean TL, Tucker R, Noakes TD, St Clair Gibson A. Effect of anticipation during unknown or unexpected exercise duration on rating of perceived exertion, affect, and physiological function. Br J Sports Med. 2005;39(10):742–746. doi:10.1136/bjsm.2004.016980
- Swain DP. A model for optimizing cycling performance by varying power on hills and in wind. Med Sci Sports Exerc. 1997;29(8):1104–1108.
Train smarter with WattLog.pro
WattLog.pro collects data from your trainer and shows what's really happening with your fitness.
Analyze your ride — no account needed →Upload a GPX or TCX file from Strava or Garmin. How to get one?